Page 3: Dependent Variables and Control Samples
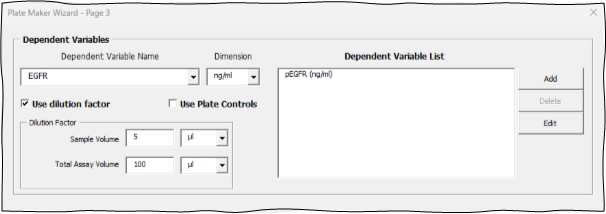
This section allows you to enter the measured or dependent variables of the experiment. Each variable entered here will result in a section in the Flat Data Table and a separate worksheet page in the data entry workbook the Platemaker Wizard builds.
Dependent Variable Name: Enter the name of your dependent/measured variable.
Dimension: Although optional, it is highly recommended you enter a dimension in this field even if it is for cell count. This field is a dropdown list that remembers the dependent dimensions that have been previously entered.
Dependent Variable List box: Lists the dependent variables and dimensions (in brackets) added to it using the Add button.
Add Button: Add whatever is currently in the Dependent Variable Name field and Dimension field into the Dependent Variable list box.
Delete Button: Deletes any selected row of the Dependent Variable list box.
Edit Button: Replaces the contents of the currently selected row of the Dependent Variable list box with the current data contained in the Dependent Variable name and Dimension field.
Use dilution factor: Tick this option to enter a global dilution factor calculated from the sample volume added to the microtitre plate in relation to the total assay volume in the well.
Dilution factor
Sample Volume: Enter the sample volume and dimension. The dimension will normally be microlitres (µl) but this dropdown menu also allows millilitres (ml) to be selected.
Total Assay Volume: Enter the total assay volume in the microtitre well. The dimension for this volume will normally be microlitres but millilitres can also be selected from the dropdown menu. The dilution factor conversion factor is then
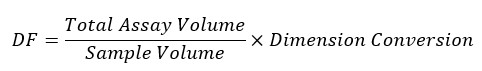
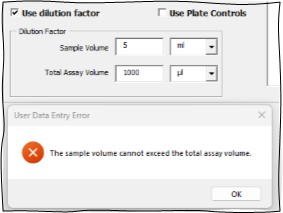
Where Dimension conversion is 1000 if the sample volume is in µl and the total assay volume is in ml or 0.001 if the sample volume is in ml and the total assay volume is in µl. However, note that the dimension conversion must always be greater than 1 because it is not possible to add more sample volume than total volume so if you try to enter a sample volume that is greater than the total assay volume you will get the following error message:
Use Plate Controls: Ticking this option activates the lower half of the form that specifies the definition of plate controls.
Experimental Plate Controls or Standards
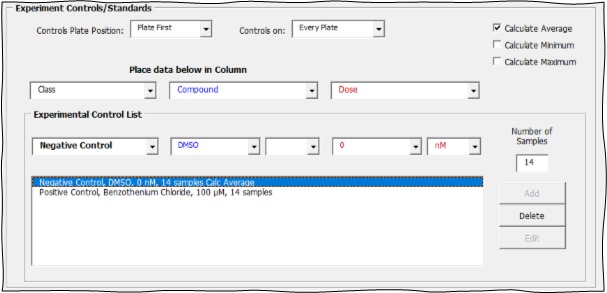
Background
Experimental plate controls exist completely independently of the samples that are generated by page 2 of the Wizard. However, plate control data values need to be injected into the appropriate independent variable columns of the Flat Data table which is controlled by the three dropdown list boxes below the title “Place data below in Column”.
Controls Plate Position: The first dropdown list box allows you to plate the controls either first on the plate before any of the experimental samples, or last on the plate after all the experimental samples.
Controls On: dropdown list box allows you to plate the controls on the first or last plate only or for the controls to be on every plate. Note if the controls are on the first or last plate only, this applies within each experiment so if you have more than one experiment, the controls will appear multiple times (matching the number of experiments entered) on the first or last plate of each experiment defined on page 1 of the wizard.
Calculate Average: This option will allow the average dependent variable value of the N controls (where N is the number of control samples defined below) to be used in workbook equations defined on Page 4 of the Wizard.
Calculate Minimum: This option will determine the minimum dependent variable value of the N controls. This value can then be used in workbook equations defined on Page 4 of the Wizard.
Calculate Maximum: This option will determine the maximum dependent variable value of the N controls. This value can then be used in workbook equations defined on Page 4 of the Wizard.
Place Below Column: You can select up to 3 Flat Data table columns into which you can inject your control values. The order specified does not need to match the column order of the Flat Data table. Likewise, you do not have to use all three options. If the control value resides fully in one column of the Flat Data table, then just use the first dropdown list which is colour coded black. The second and third injection columns are colour-coded blue and red respectively, so that it is easy see in which Flat Data table column each control value being entered is going to be placed.
Experiment Control List: The first value of the experiment control should be text that indicates what the experiment control is. Values entered into the second and third columns of the Flat Data table can be text or numeric values. If you enter numeric values, you can also enter the corresponding dimension for that variable. In Figure 1, we are injecting control data into three columns of the Flat Data table (Class, Compound and Dose). We have two main plate controls consisting of the negative and positive control respectively. The negative control 3 column values are: Class = “Negative Control”, Compound = ”DMSO” and Dose = “0 nM”. The positive control 3 columns values are Class = “Positive Control”, Compound = ”Benzothenium Chloride” and Dose = “100 µM”. In this example, it would be possible to omit the Class data as both the class and compound name uniquely identify the control type. However, if the Class data is omitted then whatever the value of the last class was, when the experimental samples were laid down on the plate, that value would be copied over into the class column for the Flat Data control rows (see Tutorial 5: How the Wizard sets the Values of Non-Specified Independent Variables for Controls).
Number of Samples: This refers to the number of controls and so allows the number of control samples on the plate to differ from the number of experimental samples. Note however, the number of experimental samples does influence this value as follows:
If the experiment has only single samples but multiple repeats, then the multiple control values will be experimental repeats and treated as such when calculations on dependent variable equations are processed.
If the experiment has both multiple repeats and samples then the number of controls refers to samples not repeats. In this instance, the total number of plate controls will be equal to the number of control samples (set here) multiplied by the number of plate repeats set on page 1 of the Wizard.
Controls List box: Contains the control data specified in the fields above and added to the list box using the Add button
Add Button: Adds the control data specified in the fields above to the list box.
Delete Button: Deletes rows that are selected in the Controls list box.
Edit Button: Replaces the selected row in the Controls list box with the current data in the fields that are used to describe a plate control.
< Prev button: Steps back to Page 2, Define Independent Variables page.
Next > button: Steps forward to Page 4, Equation Editor page.