Cleaning up Data
Background:
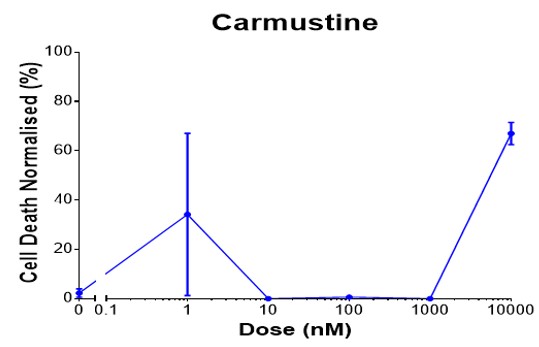
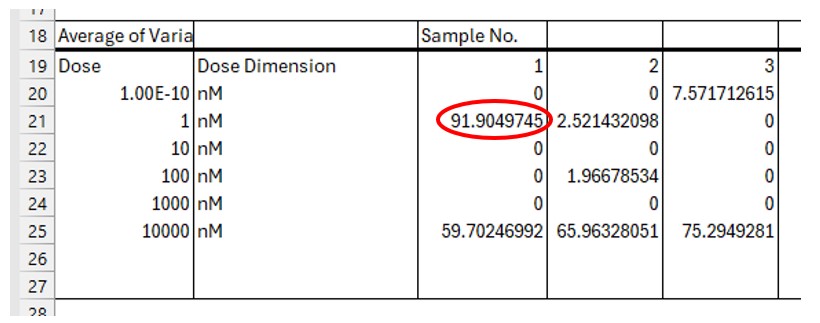
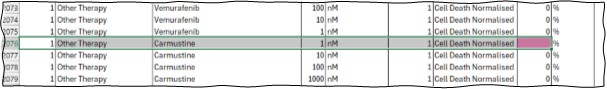
Once you have imported and generated visualisations of your data you can then look for obvious problems. For example, if you have plate replicates, the mean value of these replicates may result in a large error bar indicating the presence of an obvious outlier (Figure 2). In the example below there is a value of 91.90 which is an obvious outlier compared to the other values of 0 and 2.52 (Figure 3).
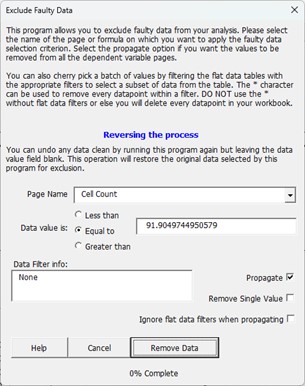
You can use the Clean Data program to reversibly remove such outliers without deleting the original values that were imported into the plate areas of the container workbook. First, place your cursor on the data and then select Platemaker Wizard ![]() Clean Data or use the short cut key <Alt> + XPE (while holding the Alt button and then push in sequence the keys X,P,E). The menu in Figure 1 will appear. The top half of the form contains some brief instructions on how to use its various functions which are explained in more detail below.
Clean Data or use the short cut key <Alt> + XPE (while holding the Alt button and then push in sequence the keys X,P,E). The menu in Figure 1 will appear. The top half of the form contains some brief instructions on how to use its various functions which are explained in more detail below.
Cleaning Data form controls
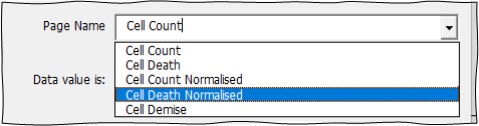
Page Name dropdown box: This contains all the dependent variables of the experiment including all the formulas that have been described in the Platemaker Wizard container workbook. In the current example, we want the cleaning program to search for the number 91.9049745 in the Cell Death Normalised section of the Flat Data table so we should select this formula name from the dropdown list as shown.
The cleaning form presents three options for comparing values in the Flat Data table’s dependent variable section with the number in the “Data Value” field on the Cleaning Data form.
Less than: all values in the selected dependent variable section of the Flat Data table whose values are less than the number in the “Data Value” field will be deleted from the Flat Data table unless column filters have been set in the Flat Data table.
Equal to: only values in the selected dependent variable section of the Flat Data table which equal the number in the data value field will be deleted. In the example above, the data value is specified to 9 decimal places so it is very unlikely that there will be two Cell Death Normalised values that match exactly to 9 decimal places. Therefore, you can safely just push the “Remove Data” button once you have selected which dependent variable name the value corresponds to and only a single value will be deleted from the Flat Data Table. If, however, you manually type a number such as “520” and are searching a dependent variable like cell count (which only has whole numbers in it), then it is likely that there will be multiple data points that share that value. If you are only wanting to delete a very specific single data point then you either need to set the Flat Data Table filters, so only the value you want to delete is visible, or you can tick the “Remove Single Value” option (see below).
Greater than: all values in the selected dependent variable section of the Flat Data table whose values are greater than the number in the data value field will be deleted from the Flat Data table unless column filters have been set in the Flat Data table.
Data Filter Info Box: This is a free text box where you can record the details of the filters you set in the Flat Data Table before you ran the Clean Data program. When you run this program to delete values, it records its activities on the Exp Details worksheet in the yellow Description text area (Figure 11). Any information you add in the Data Filter Info box will also be transferred to the yellow Description text area so you have a permanent record of the cleaning strategy you employed on your Platemaker Wizard container workbook.
Propagate: means that not only will the Wizard remove the selected value, it will also remove all the other dependent values associated with that value (values that share the same independent variable combination). In our current example, we are removing a calculated value Normalised Cell Death, but this number is a calculation based on raw cell death plate data. Selecting the propagate option means that all values for Carmustine 1 nM sample 1 will be deleted, including other dependent variable data such as cell count. This may not always be appropriate if the error is caused by a single channel issue but often it is better to remove the value across all measurements, especially if this is a High Content Screening experiment. In contrast, this option would be inappropriate if the dependent variables are derived from different ELISA plates.
Remove Single Value: this option allows you to see which number is about to be deleted from the Flat Data Table before it happens. The user is presented with a little Yes/No dialogue box to choose whether to delete that value or skip it as shown in Figure 4. If it was not the correct value, then simply click “No” and it will continue searching the Flat Data table until it finds the correct value.
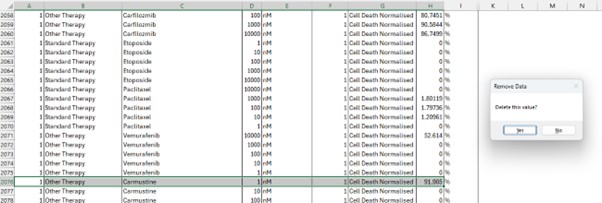
Alternatively, click “Yes” to delete the value as shown.
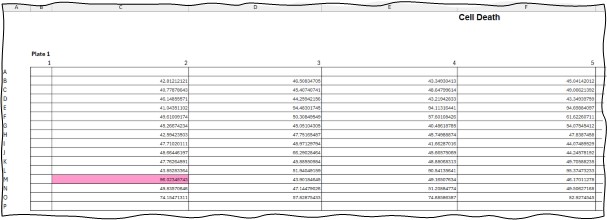
If you go to actual workbook pages that contain the scan data, the value is still present on the plate but highlighted in red to show it is excluded from data analysis.
Ignore Flat Data filters when propagating: is used when you are cherry picking values by using an extra column outside of the Flat Data table (see Cherry picking values in the Flat Data Table) or you are selecting values in the Flat Data table by using the dependent variable column filter in the Flat Data Table rather than its independent variable column filters.
Updating previously built Pivot tables after excluding faulty datapoints
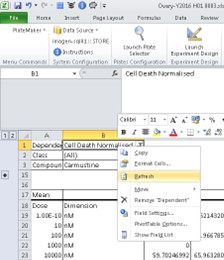
If you have already added pivot tables to your workbook before you removed faulty data, you need to go back and update pivot tables to reflect all the data deletions you have made. To do this, place your cursor on a pivot table filter field, right click the mouse to bring up the tables context menu, and select refresh (Figure 5).
Using the Flat Data Table Filters to find an anomalous data value*
Consider the following dose response curve below (Figure 6).
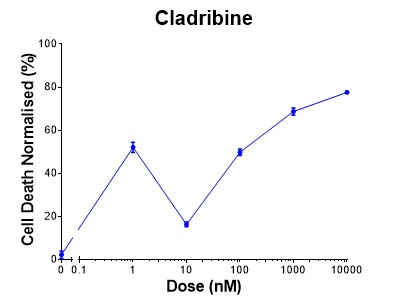
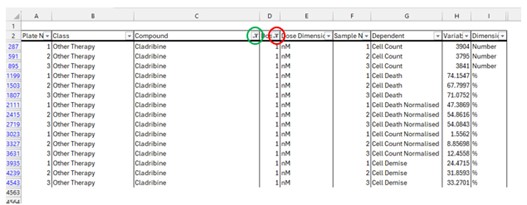
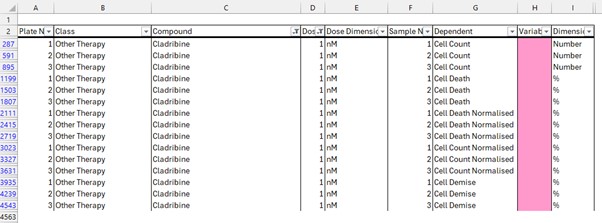
In this instance, we may choose to remove all the data that constitutes the 1 nM Cladribine dose. To do this, go to the Flat Data table and set the relevant filters in the columns of the table so that only 1 nM Cladribine is showing (Figure 7).
Now run the cleaning tool and enter a * character in the data value text box. The star value tells the Wizard to delete all values that are visible in the Flat Data table. It is also helpful to use the Data Filter Info box to fill in what filters were applied on the Flat Data table when you ran the cleaning program. As described above, this information is transferred to the yellow description box in the Exp Details worksheet at the front of the workbook Figure 11.
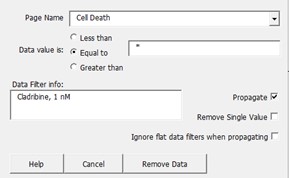
When you use the special “*” character the following warning message will be displayed when you push the “Remove Data” button.
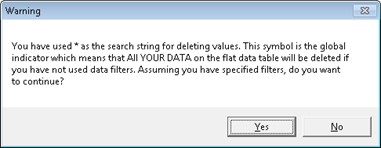
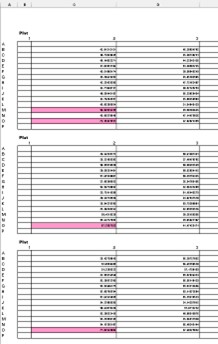
If you have selected the filters properly then push “Yes”. Push “No” if you have not filtered your data or else, as the warning says, you will delete everything in the selected dependent variable, or, if you have also selected the propagate option, then all the data in your Flat Data table will be deleted. In our example table shown in Figure 7, after the “Remove Data” button is pushed, all the values that are showing in Figure 7 are deleted as shown in Figure 9. Switching to one of the container worksheets, values on plates which have been removed from the Flat Data table are also highlighted in pink (Figure 10).

See also Undoing Deletions.
*Please note: this manual is in no way teaching you how to massage data to make it fit your preferred hypothesis. This example is purely to understand the functionality of the Platemaker wizard. An outlier like this might be an experimental error or it might be trying to tell you something. In experiments I once did with EGFR inhibitors, it turned out that very low doses of the inhibitor could stimulate downstream Erk signalling because the ATP binding site inhibitors at low doses still caused the EGFR receptor to dimerise. Yet at low doses only one ATP binding site was blocked resulting in a downstream signal from the other partner of the receptor dimer.