Copy to/from Prism Graph
Most instruments that measure ELISA assays allow you to fit data to a standard curve before exporting it. However, if you only have raw absorbance data that requires fitting to a standard curve then the “Copy to/From Prism Graph” function is useful to help you export the data to a curve fitting program such as Prism graph. The way to use this program is as follows. Select the data from the original microtitre plate that you want to export to Prism Graph.
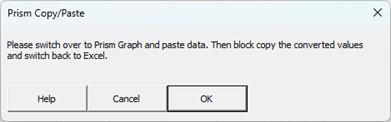
And select “Copy To/From Prism Graph”. The following dialogue box will be displayed.
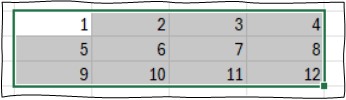
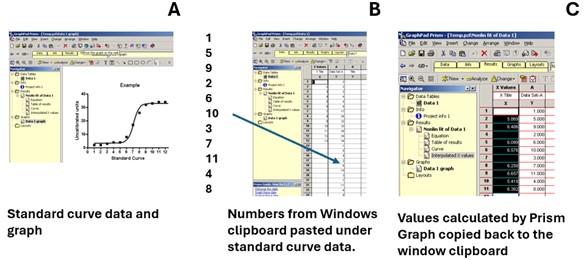
At this point, the program will take the data selected in Excel and copy it to the clipboard converting it to a single column of numbers. For example, if you selected the following 2D matrix of numbers above, they will be converted into a single column of numbers by stepping through the numbers column by column as shown in Figure 2A.
This single column format is compatible with the Prism Graph Curve fit feature (Figure 2). Using Prism Graph or a similar type of program one can now highlight the new fitted value (Figure 2C) and copy these values back to the clipboard.
When you switch back to Excel you now can press OK on the dialogue box (Figure 1) and the following message will be displayed:
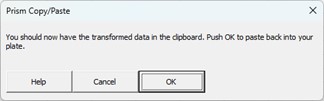
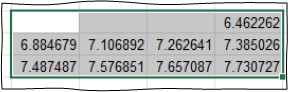
This second message is to make sure you have the transformed data copied into the clipboard from Prism Graph. Now simply push OK and your original selected numbers will be replaced by the newly calculated number from Prism where conversion was possible: