Page 5: Plate Layout Designer
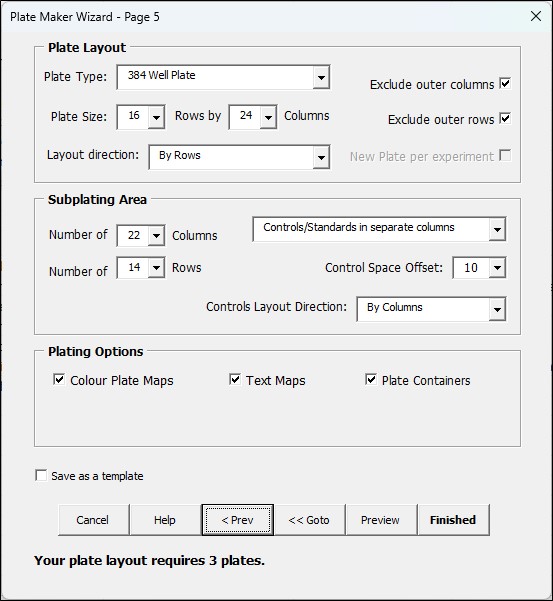
Plate Layout
Plate Size: select the plate dimension rows and columns. The smallest plate size that can be selected is a 6 well plate (2 rows, 3 columns) to a 1,536 plate (32 rows, 48 columns). You can select the number using the dropdown list or by typing the number directly into the field.
Exclude outer Columns/Rows Options: Excludes the edge columns and/or rows of a plate. It is normal practice, especially in HCA assays conducted on 384 well plates, to exclude the outer rows and columns as these wells are subject to more evaporation and so data from these wells, especially for longer 72-hour time points, is not always accurate.
New Plate per experiment: If you have specified more than one experiment on page 1 of the Wizard, then selecting this option will start each experiment on a new plate rather than continue to layout the samples of the new experiment straight after the samples from the previous experiment.
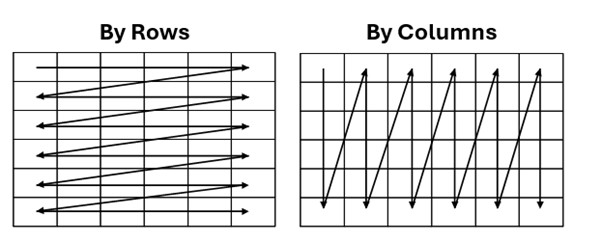
Layout Direction: This sets the main layout sample direction on the plate. Samples can be laid out in either rows or columns.
Subplating Area
You can divide the main plate area into subareas. The plate sub-area columns and rows dropdown list boxes can range from 2 to a maximum of the original plating area. The algorithm does the following with the sub-area dimension

Main plate row dimension (PRD), main plate column dimension (PCD), subplate row dimension (SPRD), subplate column dimension (SPCD) and lowest whole number (int).
This formula effectively rounds up the number of times the subplating area fits into the rows and the columns of the physical plate, creating extra plate areas that cover the remaining areas of the plate that have dimensions which are less than the subplate area.
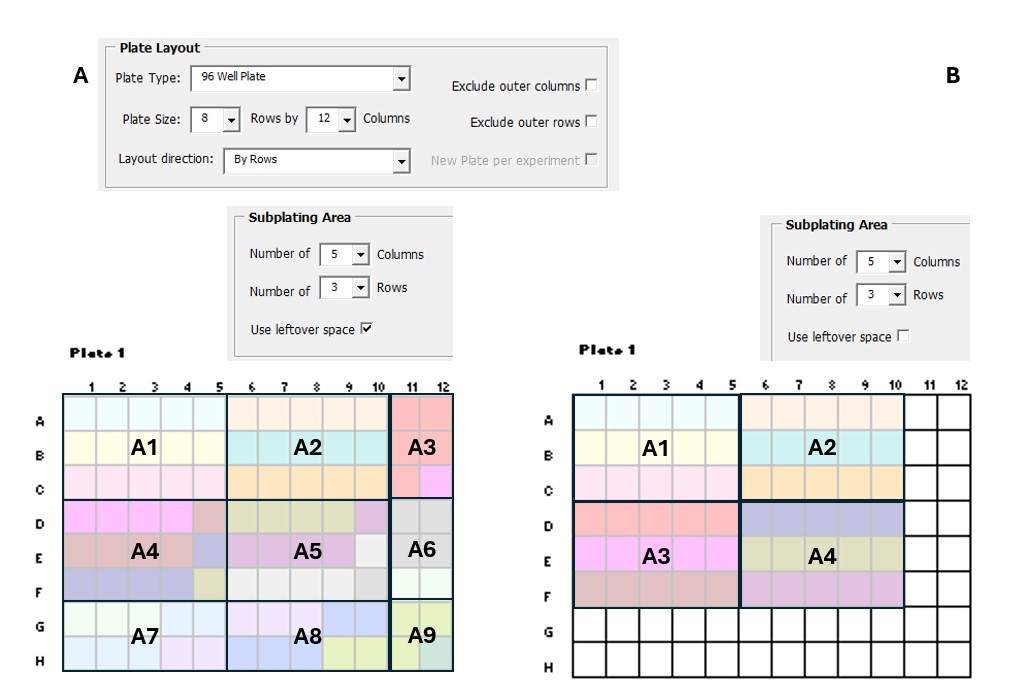
If you uncheck the “Use leftover space” option, then samples are not added to the subplate areas which are less than the subplate dimensions, in this instance the number of subareas becomes

In Figure 2, a 96 well plate is divided up into smaller 5 columns by 3 rows subplating areas resulting in 4 subplating areas that match these dimensions and a further 5 areas with dimensions less than the plating subarea as shown in Figure 2A. The Platemaker Wizard lays out each compound (which has 5 doses) generated from the Flat Data table in rows filling in each plate sub-area sequentially as indicated in the figure. The 5 doses of the red compound in A3 must occupy 2.5 rows because there are only 2 rather than 5 columns to accommodate it. This means the first dose of the next compound is placed in A3 meaning that A4 now has only 4 pink compound doses rather than 5, making for a mixed-up plate map. Unchecking the “Use Leftover Space” option fixes this by only plating in the subplate areas that match the subplating area size of 5 columns x 3 rows. The partial areas are then left empty (Figure 2).
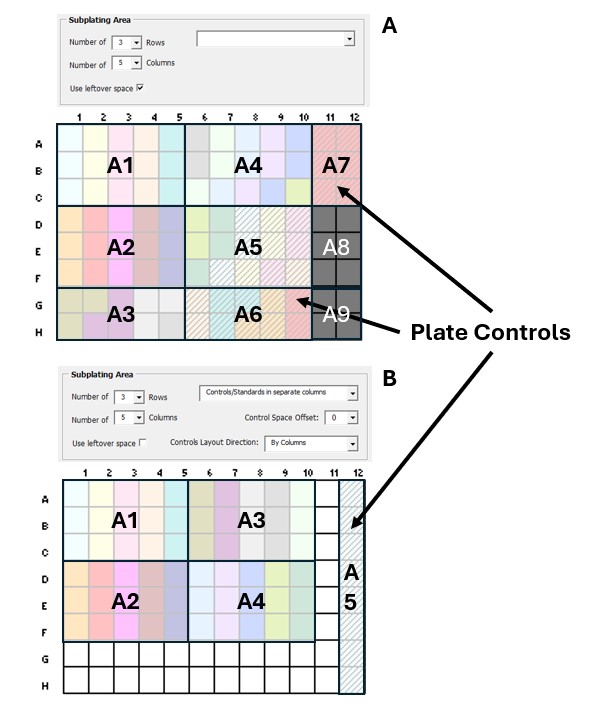
Subplating areas and Controls
If controls are included in your experiment, then depending on whether you selected them to appear first or last on the plate, they will be added to the plate (Figure 3A). When your experiment has controls, a new dropdown list box becomes available that allows the controls to be plated in their own separate row(s) or column(s). The algorithm determines the minimum number of rows or columns it needs to set aside on your plate to fit the controls into their separate plating area. In the example below, we have 8 controls, so they nicely fit into a single column on a 96 well plate. We have also selected the main sample plating direction to be in columns so the subplating area also follows that direction down the plate in contrast to when we were plating in rows (Figure 3) where the areas were placed sequentially across the plate.
Control offset: In the control definition section of the Wizard, you can specify whether you want the controls to appear before all the samples on the plate or after all the samples. The control offset further allows you to fine-tune the layout by offsetting the controls from the left side of the plate by the number of columns (if you selected to plate the controls in separate columns) or the top of the plate by the number of rows (if you selected to plate the controls in separate rows) thus moving the overall control section towards the centre of the plate.
Control Layout Direction: Allows the control layout direction, inside the control plating area, to be changed independent of the main experiment sample direction.
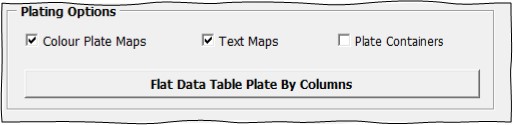
Plating Options
Colour Plate Maps: This option determines whether the Plate Maps worksheet is included in your final workbook build. Switching this option off does increase the speed of workbook construction as creating all the plate maps for a big experiment is time consuming.
Text Maps: This option determines whether the Text Map worksheet is included in your final workbook build. Note before data is added to the container workbook worksheets, all the plates contain a text map so unticking this option does not save any time when creating a large workbook because the information is simply copied from one of the container worksheets (unless you also choose not to use Plate Containers).
Plate Containers: This option determines if the container worksheets, where the raw plate data will be added, are included in the worksheet build. If your plate reading instrument can return its data in a single column format, you may wish to paste the data directly into the Flat Data table “Variable column”, in which case plate containers are unnecessary. In this instance, you might still like to select Text maps so that you have a copy of how the samples were originally laid out on your experimental microtitre plate.
If you choose to build the workbook without plate containers then the following toggle button choice becomes visible
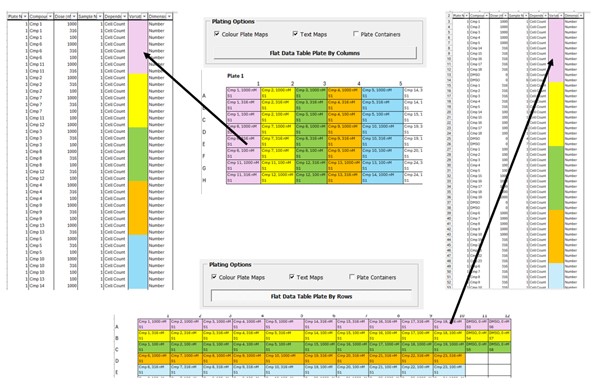
This option sets how the single column of values relates to the 2-dimensional layout of the plate. “Flat Data Table Plate By Columns” means that as the program goes from row to row in the Flat Data table, it is also going from plate-row to plate-row on the microtitre plate as shown in the top plate of Figure 4. “Flat Data Table Plate By Rows” means that as the program goes from row to row in the Flat Data Table, it is also going from plate-column to plate-column on the microtitre plate as shown in the bottom plate of Figure 4.
Other Functions
The “Save as Template option” activates a dropdown list field with all your previously saved templates. Simply type the name of your new template that you want to save. If you select one of your previously saved templates, you must alter the name slightly as the program does not allow you to overwrite a previously saved template. Alternatively, you can go to the template editor and the delete the template you wish to overwrite before returning to Page 6 of the “Create New Data entry” workbook Wizard.

< Prev button: Steps back to Page 5, the equation editor page.
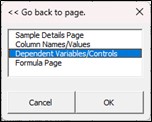
<< Goto Button: brings up small list box so you can directly return to any previous page of the Wizard to quickly change data on that page.
Preview Button: Builds the workbook but provides a small dialogue box which allows the user to accept the build or dismiss it to return to Page 5 of the Wizard (or any other page) so that adjustments can be made until the user has achieved their desired plate layout as shown via the colour or text plate maps.
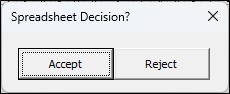
Note if you have chosen to save the file on page 1 of the Wizard, once you push the Accept key the workbook will be saved under the Experiment title name and in the file path determined by the “Project Name/Organization Name”, “Project Manager Name/Customer Name” and “Experiment Title”.
Finished: Dismisses page 5 of the Wizard and builds the workbook without the option to reject it. If you chose to save the workbook on page 1 then the workbook at this point will be saved. Effectively pushing “Finished” is the same as pushing “Preview” and then the “Accept” button from the dialogue menu box directly above.