Page 2: Defining the independent Variables
Defining Columns
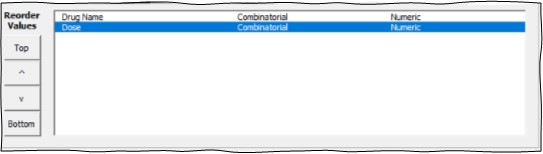
Column Names: This field allows the user to enter the independent variable labels which will constitute the column names of the Flat Data table. The order the labels appear in the list box below this field, controls how the data contained in those variables is grouped (see below).
Link type: This is a dropdown list that contains two values: Combinatorial and Linear. If you have defined two variables ∝ and β such that variable ∝ contains the values (A, B, C) and variable β contains the values (1, 2, 3, 4, 5), and they appear in the list box below in the order ∝ then β, then the combinatorial link α×β will generate 15 samples in the following order (A1, A2, A3, A4, A5, B1, B2, B3, B4, B5, C1, C2, C3, C4, C5) while the list box order β then ∝ (β×α) generates 15 samples in this order (1A, 1B, 1C, 2A, 2B, 2C, 3A, 3B, 3C, 4A, 4B, 4C, 5A, 5B, 5C) where each element is an individual well sample that is uniquely represented by the two independent variables and their respective values. If ∝ and β are linearly linked (∝-β) then the output will generate whichever variable contains the maximum number of values (in this example β contains 5 values) so the output will be (A1, B2, C3, A4, B5) while (β-α) results in (1A, 2B, 3C, 4A, 5B). Note: although the order of the linear link changes the order that the independent variable appears in the Flat Data table, the plate layout is not affected because the third element of (∝-β) is “C3” and this is equivalent to the third element of (β-α) which is “3C”. This is not the case with (α×β) because the third element is “A3” which is not equal to the third element of (β×α) is “1C”. See Tutorial 3.
Text Variable: Tick this option to toggle the Column Data input from numeric values only to text values.
Pause Build: Tick this option to pause the building of the Flat Data table at the point where the independent variable that contains the pause build flag has been processed. This option allows the user to then access each element or sample of the Flat Data table, entering unique values that would not be generated by a combinatorial operation. For example, in the 15 samples generated by combinatorially linking α×β, the user might choose to manually change the third element A3 to a unique value A23.
List box and reorder buttons: The List box contains the column names entered above, and the reorder buttons allow the user to order the labels inside the list box which is important in how the values are grouped inside the Flat Data table (see Link Type above).
Column Data
Numeric/Text Value: Allows the user to type the values for the independent variable selected in the “Define Columns” list box above.
Dimension: If the independent variable is numeric then an extra dimension field (which is a dropdown list box) is visible which allows the user to record the dimension of the independent variable value being entered. This is usually important especially if the independent variable is a dose or a duration numeric variable. The dimension list box contains usual dimensions that are associated with numeric independent variables that are commonly used in biological experiments.
Add Button: Add the value typed in the numeric/text value field to the Column Data list box below the numeric/text value field. Note you can also just push the keyboard “Enter” button to also quickly add new data.
Delete Button: Deletes any values selected in the data list box.
Clear All: Deletes all data in the data list box
Edit: Changes the value that is selected in the data list box with whatever value is currently in the numeric/text value field. Note if you have multiple values selected, only the last value selected will be changed. Also, if you have the same value repeated multiple times, then all values matching the last selected value will be changed to the new value.
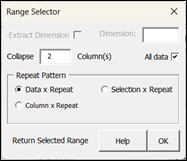
Add from external worksheet: temporarily dismisses page 2 allowing the user access to the workbook that is currently open behind the Wizard. The user can then select the values from that workbook they want to put into the Column Data list box using the range selector menu described below (Click the arrow key below to see more information about the range selector).
The Range Selector
If the independent variable that you are returning data to is numeric, then the range selector will have the following fields active.
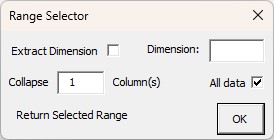
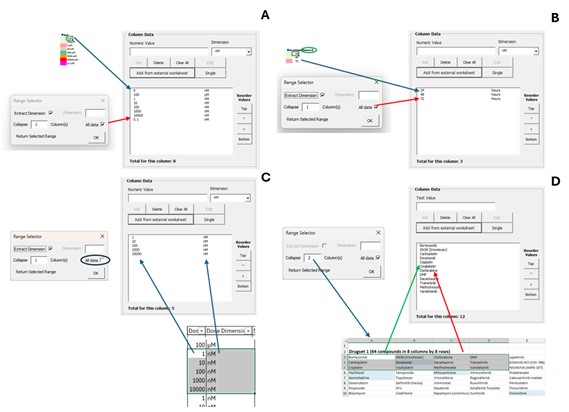
Extract Dimension: If you select cells that contain numbers followed by letters then the program will split the numbers from the letters placing the numbers in the numeric part of the Column Data list box and the text component into the Dimension column of the Column Data list box field as shown in Figure 1A. If you select a set of numbers from a plate map key, and there is a title that contains a dimension in brackets, then the range selector will be able to extract the dimension from that title (Figure 1B). If you select two columns of data, one with numbers the other with letters, then the numbers column will be added to the numeric part of the column data list box and the 2nd column with text will be added to the dimension column of the data list box (Figure 1C).
Dimension Field: If you choose not to Extract dimension automatically, you can manually enter it in this field so that it is imported with your selected number data.
All Data: If you have the Excel workbook cursor on a single worksheet cell and you have ticked the “All Data” option, then the Platemaker Wizard will extend the selection, so it contains all the rows below the selected cell that contain data. Note: if you already have a range selected, then the “All Data” option is ignored.
Collapse Column(s): The collapse Column(s) field controls how multiple selected columns are converted into a single column of values for the Column Data list box. This is explained in more detail here. Likewise, in Figure 1D, text data that occupies 4 columns and three rows is being imported. The 4 columns are converted to one by copying (in rows) the first two columns, and then the second two columns.
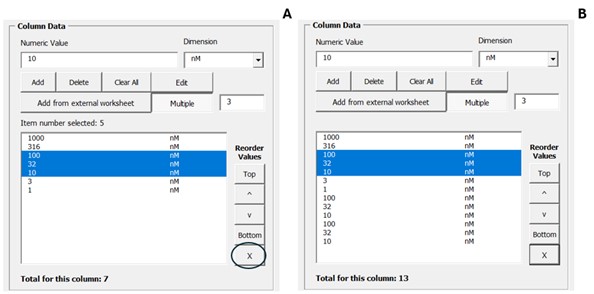
Single Multiple Toggle Switch: The default is “Single” meaning any value typed into the Numeric/Text Value field and added to the Column Data list box will, as expected, be added as a single value. If this button is toggled to “Multiple” a new field and button appears in the Column Data section as shown in Figure 2.
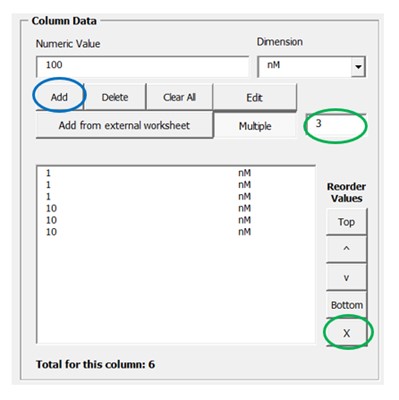
If you enter a number in the Multiple field, then any further data entered in the Numeric/Text value field shall be entered that many times. This way, it is possible to replicate the grouping of data if you are using linear rather than combinatorial links. This is discussed in more detail in Tutorial 3. Alternatively, you can select a set of previously entered values in the column data list box and push the “X” button. This will then replicate those selected values one less the number that is in the Multiple field as shown in Figure 3.
The Range Selector when the multiple toggle button is active
If you choose to Add data from an external workbook and you have the toggle button depressed to return multiple values, then the range selector contains an extra section as shown.
This extra section controls how the data you have selected will be replicated by the multiple value that you have entered next to the toggle button in the Column Data section of page 2. The “Data X Repeat” simply replicates each data point by your multiple value and is equivalent to you typing in each individual value while you have the multiple button active and a replication number in the field next to the toggle button.
Likewise, the “Selection X Repeat” just takes whatever the total set of data is to be returned to the Column Data list box and replicates it by the number you have entered in the multiplier field. This is equivalent to you first entering the data, selecting it all in the Column Data list box, and then pushing the “X” button below the navigation keys.
The final option is the “Column X Repeat”. This option replicates the incoming data based on the collapse columns value entered above. If the collapse column value is set to the same number of columns as the range you are returning, then it will have the exact same effect as the “Selection X Repeat” Option. However, for every column value less than the total columns in the selected range, the program will first take the subrange as defined by the number of columns, and then replicate that subrange. Therefore, if collapse column equals 1 then column one will be replicated by the multiplier number you have entered. If collapse column(s) equals 2 then columns 1 and 2 will first be entered (in rows) and then this data chunk replicated by the replication number you entered.
< Prev button: Steps back to Page 1, the Experiment Details page.
Next > button: Steps forward to Page 3, the Dependent Variable and Control Samples page.
Independent Value Generator
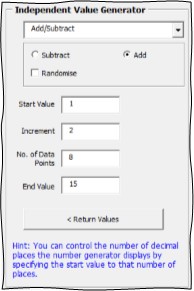
Function List box
Select from one of the 4 functions: Log, Semi Log, Add/Subtract, Multiply/Divide
Option Buttons: For Log and Semi log you can select to generate the numbers in increasing or decreasing order. For Add/Subtract you can select to subtract the Increment value from the Start Value or add the Increment value to the Start Value
Randomise check box: Select this option to randomise the values the generator returns. In this instance the numbers will not follow either an increasing or decreasing order.
Start Value: Enter the first value you want the independent value generator to return. Note this value should not be 0 if entering the first value of a log or semi-log function because log 0 is undefined.
No. of Data Points: Enter the number of data points you want the independent value generator to generate from the start value. Note if you enter a Start Value, an Increment and the No of Data Points, then the end value will automatically be calculated based on the number of data points that exist between the start and end values.
End Value: Enter the last value you want the independent variable generator to return. If you enter a Start Value, Increment and End Value, then the number of data points will automatically be generated based on the number of data points between the start and end values.